What is community detection?
The objective of this Innoviris research project and particularly that of this atlas is to identify and map groups of places that interact most. Hence, community detection methods were used: these mathematical methods cluster together observations that are tightly related.
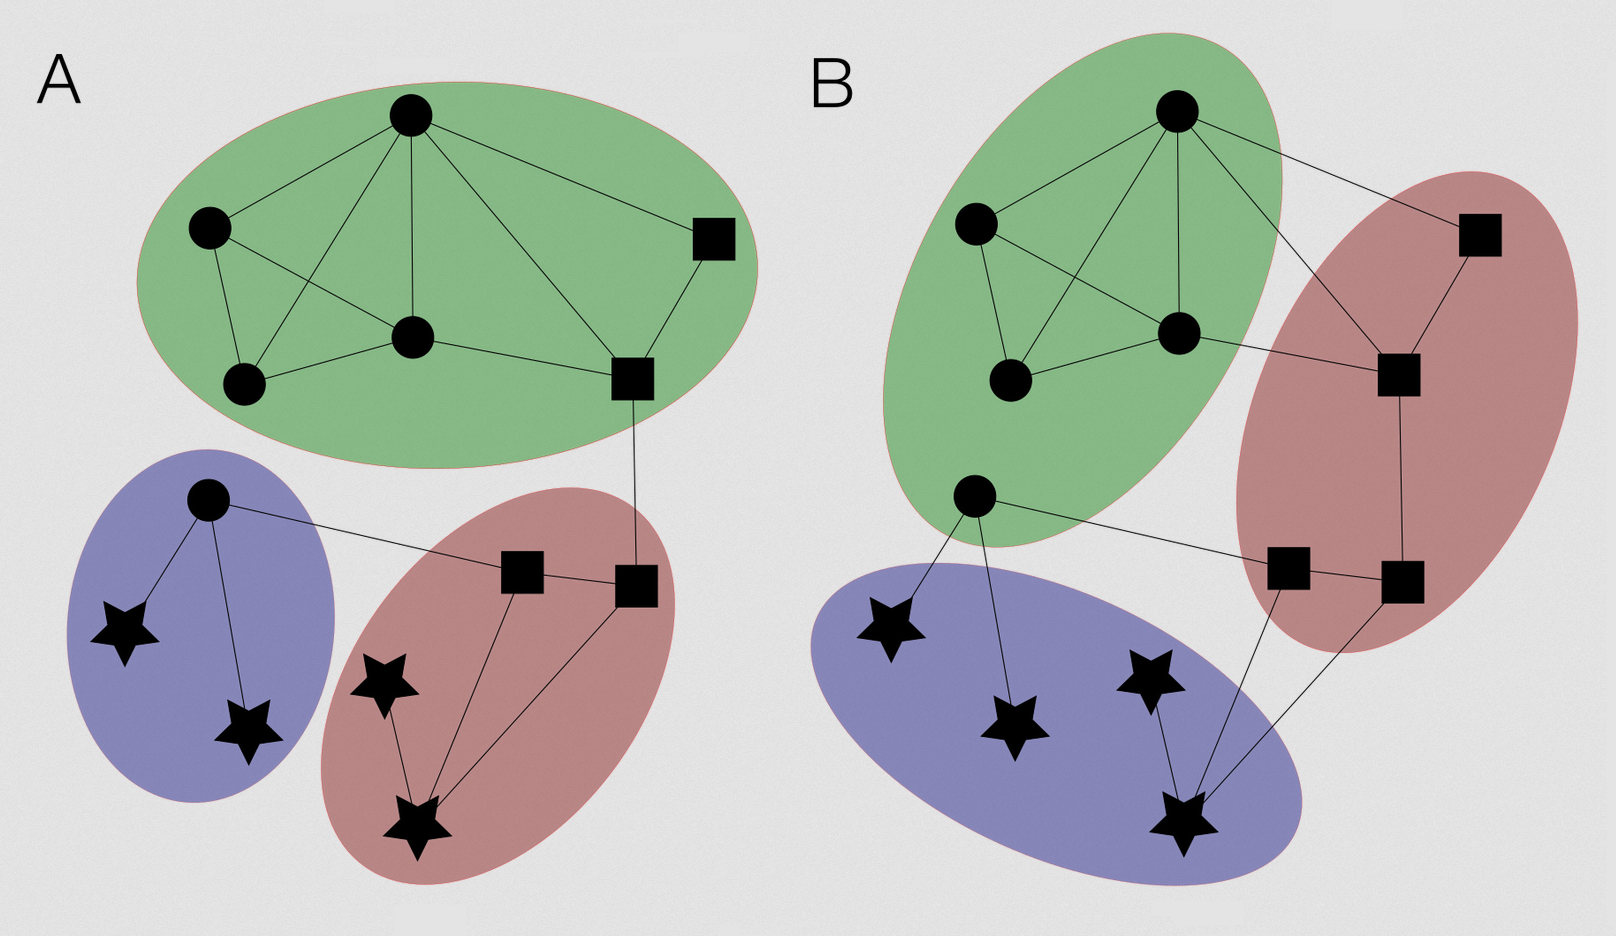
Community detection methods are aimed at finding partitions (structures composed of communities) which maximise the density of intra-group connections with respect to the density of inter-group connections, and thus at finding dense optimal sub-graphs in large graphs. In other words, these techniques are used to here detect places which have together a higher quantity of interactions than with the other places, which means that people/companies/agents located in those places have more more tight links than with those located elsewhere.
In the adjacent illustration, places (black symbol elements) are clustered together in two different ways:
Principles of the Louvain method
One of these community detection algorithms is the Louvain method, which has the advantage to minimize the time of computation [Blondel et al., 2010]. This mathematical method has become quite popular and consists in calculating a number for each partition (referred to as modularity of the partition) which quantifies the quality of the partition, and then in finding the maximal modularity partition. The quick calculation of a partition with very good – but not necessarily maximal – modularity is possible using the Louvain Method.
With this method, the grouping of observations (nodes which here are spatial units) is done with no a priori definition of centrality or accessibility: only the frequency of links between the spatial units are used. In some cases, edges could be weighted, for example by the average duration for the phone calls. The number of groups and the composition of the groups are endogenous; in other words, the method provides the optimal number of groups and their composition, with no outside intervention. The method uses a greedy algorithm to group the nodes in successive stages and builds a hierarchy of networks. At the lowest level, each node is a community. Then, at each iteration, the method selects a node from a group and adds it to the group which maximises the contribution resulting from modularity if this contribution is positive. When any modification of the joining of a node reduces the modularity, a new network is built whose nodes are the groups from the network one level lower and the process is repeated in this new network [see Blondel et al., 2010 for further details].
Outputs of the Louvain method
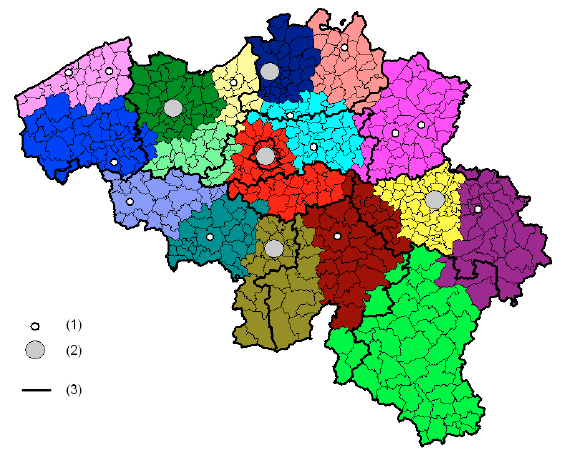
Results from this algorithm are visualized through maps where each color represents one community. Colors are selected arbitrarily. In the example opposite, places (here: municipalities) are clustered together through the Louvain method when they intensely interrelate in terms of phone calls (data based on phones billing addresses) [Blondel et al., 2010].
An additional parameter of resolution is integrated in the Louvain method in order to make both the total amount of communities and their size vary. Small values of this parameter favour a partitioning in many communities, while large values tend towards small numbers of communities [see Adam et al., 2017 for further sensitive analyses].
Consequently, each result based on a community detection procedure in atlas.brussels can be visualized according to various values of this parameter and therefore with an adjustable number of communities (see “Layer options” in the main visualization tool).